
Building Smart Agriculture & Rural AI Solutions in India Using Infineon PSOC™ 6
Anup Halarnkar
2/23/20264 min read
Introduction
India loses billions annually due to:
Late pest detection
Fungal infections (rust, blight, mildew)
Water stress
Heat stress
Nutrient imbalance
Most of these problems are detected after visible damage appears; when yield is already compromised.
This blog explores how an intelligent edge system built around Infineon’s PSOC™ 6 AI Evaluation Kit can enable early crop stress detection for a 1-acre Indian farm. So, first lets deep dive into the problem scenarios.
Crop Stress
Crop stress occurs when plants experience adverse conditions that disrupt normal growth and metabolism.
Types of Crop Stress:
Biotic Stress (Living Factors)
Insects (aphids, borers)
Fungi (rust, blight)
Bacterial infections
Viral infections
Abiotic Stress (Environmental Factors)
Water deficiency
Excess irrigation
High temperature (>45°C common in India)
Soil salinity
Nutrient deficiency (NPK imbalance)
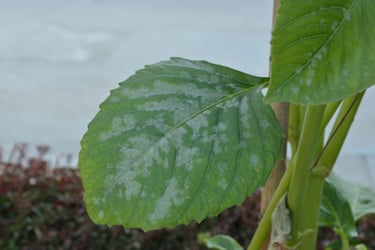
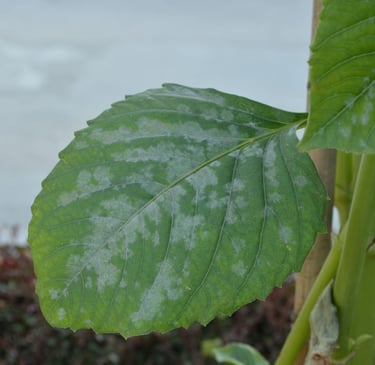
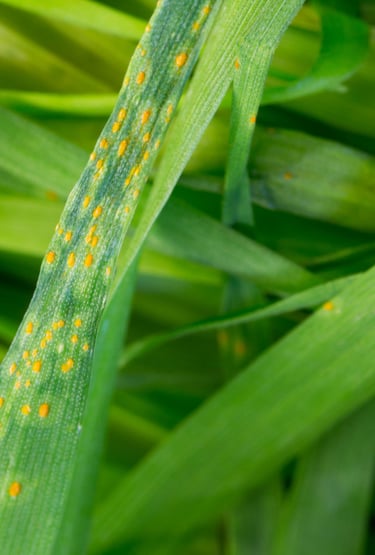
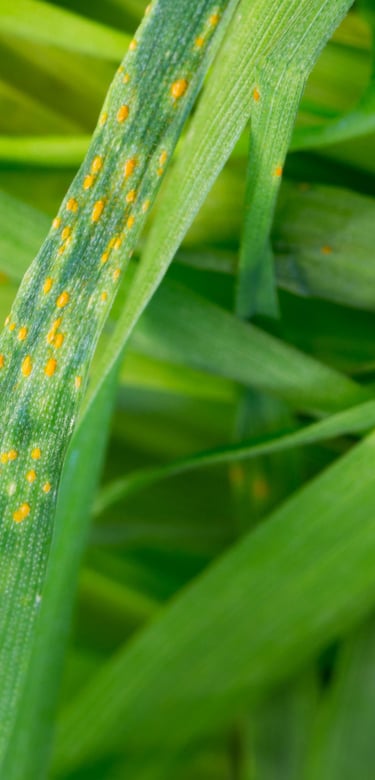

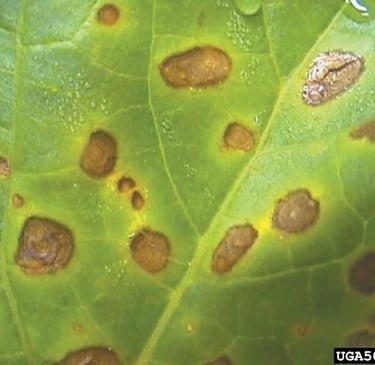
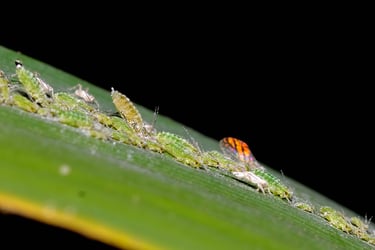
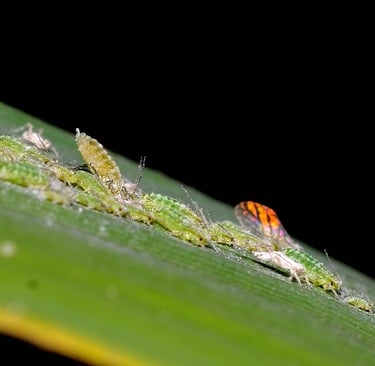
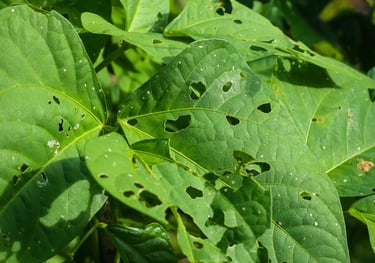
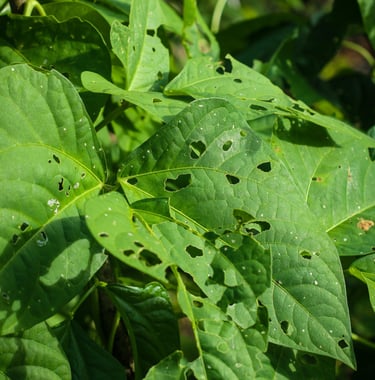


How Crops Die Due to Insects & Disease
Example: Fungal Infection Progression
Spores land on leaves.
Infection begins at microscopic level.
Chlorophyll activity reduces.
Photosynthesis declines.
Yellowing / spotting appears.
Leaf necrosis spreads.
Plant growth stunts.
Yield drops.
By the time a farmer visually notices spots, 20–40% damage may already be done.
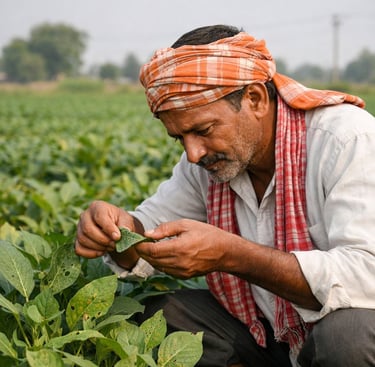
Manual Detection Methods
Traditional Method:
Walk across field
Randomly inspect plants
Observe discoloration
Check soil moisture manually
Example of Problems in a 1 Acre Farm:
1 acre ≈ 43,560 sq ft
Thousands of plants
Impossible to inspect every plant daily
Early-stage infection is invisible to the naked eye
Human fatigue
Labour cost
Disadvantages of Manual Inspection:
Misses early biochemical stress
Not scalable
Time-consuming
Scientific Detection of Crop Stress
Before visible damage:
Leaf temperature rises
Chlorophyll fluorescence changes
Soil moisture deviates
Plant reflectance spectrum shifts
Humidity patterns alter
Micro-climate imbalance appears
These signals can be captured via:
Soil moisture sensors
Temperature sensors
Humidity sensors
Multispectral camera
Leaf temperature IR sensors
Proposed 1 Acre Deployment Model
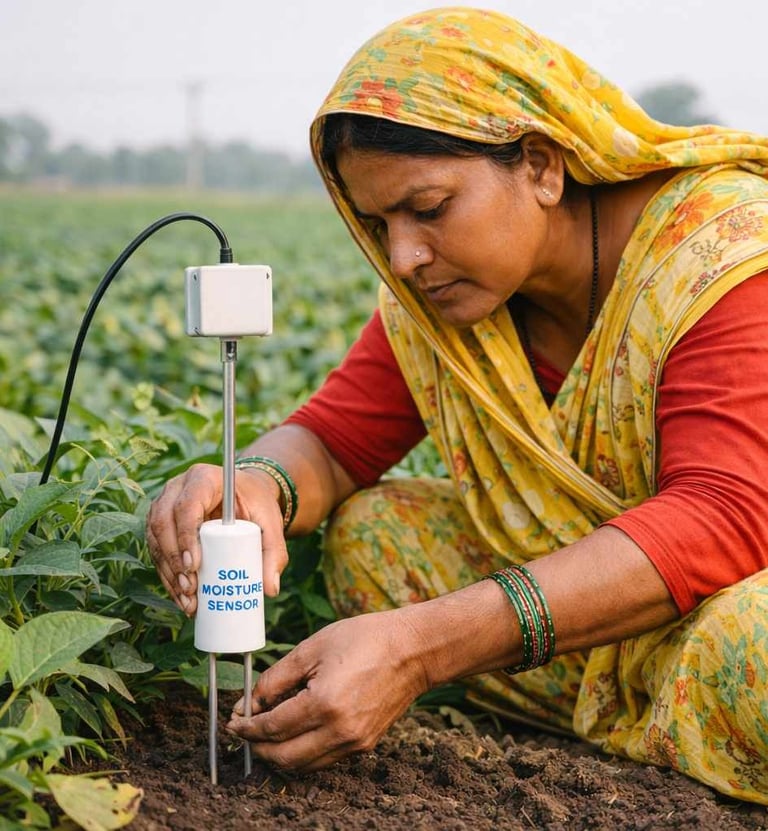
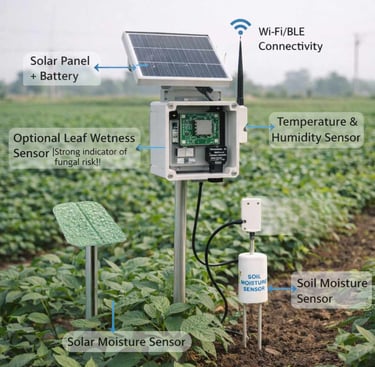
Layer 1 – Ground Sensor Nodes (4–6 per acre if ground is even levelled)
Each node includes:
Soil moisture sensor
Temperature and Humidity sensor
Optional leaf wetness sensor (Strong indicator of fungal risk!)
PSOC™ 6 MCU
Solar panel + Battery
Wi-Fi/BLE connectivity
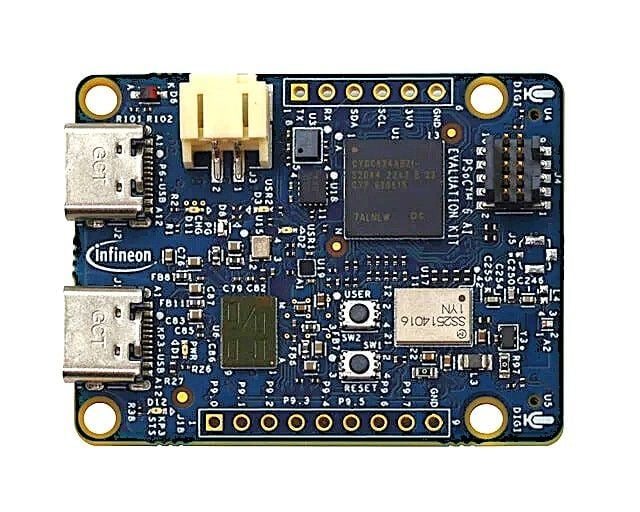
The PSOC™ 6 MCU based Evaluation board (CY8CKIT-062S2-AI):
Collects sensor data
Runs lightweight Inference locally (ML)
Predicts irrigation need
Detects abnormal humidity trends
Stores only summaries (not raw data)
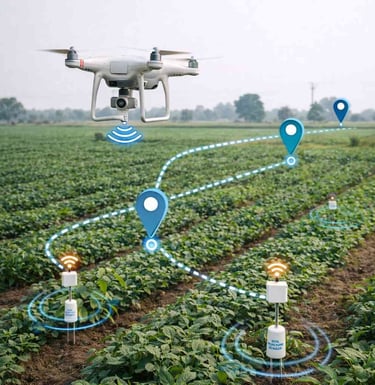
Layer 2 – Data Collection via Drone (Once per Day)
Drone flies a planned route
When within range, it shall,
Scan for BLE Advertisement
Discover a Node/Connect to the Node
Authenticate the Node
Request the Inference logs for the last 24hrs
Disconnect immediately
When it returns to Dock/Resting station:
Drone offloads consolidated logs to Laptop via USB / Wi-fi
Laptop shows a “zone wise Risk / Health Map” + Alerts + Recommendations
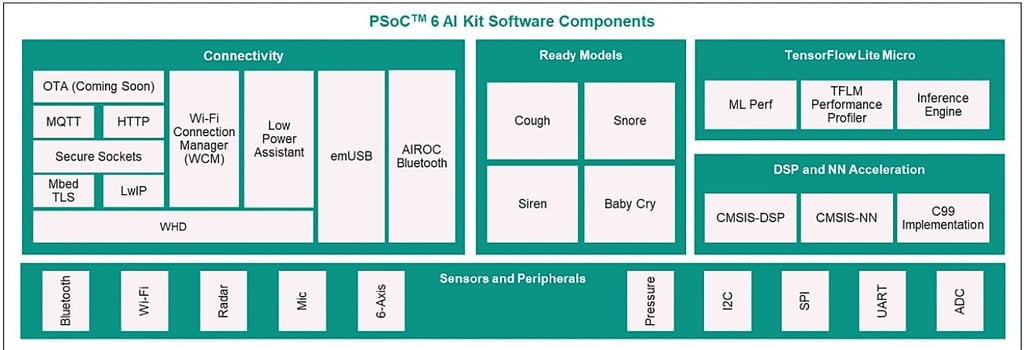
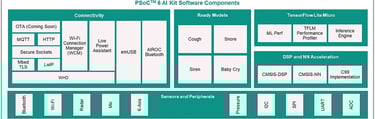
More about PSOC™ 6
Low-power solution (battery / solar powered rural deployments)
High reliability in harsh weather (45°C+ summers, humidity, dust)
Secure connected devices
Cost-efficient scalable systems
Edge intelligence (due to inconsistent cloud connectivity)
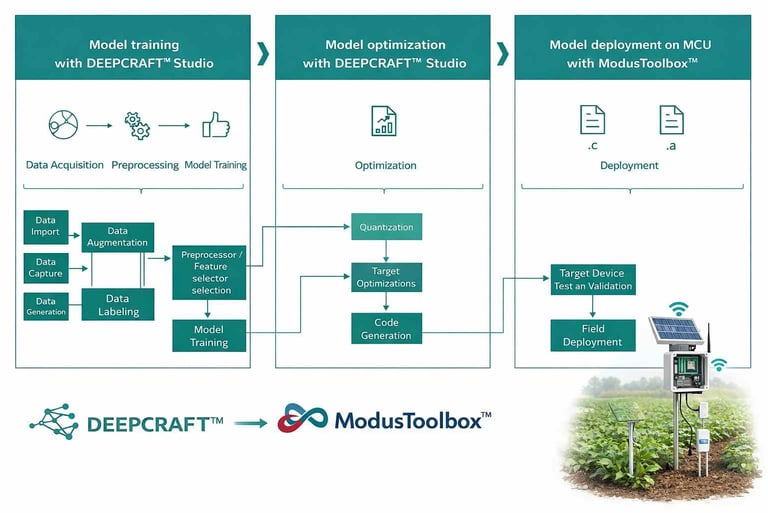
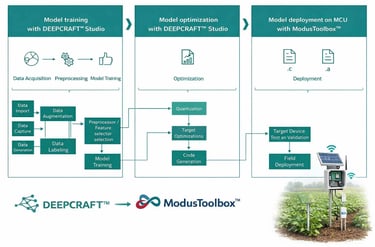
The AI kit ecosystem is designed around collecting sensor data and building models with Infineon’s tooling
DeepCraft™ helps to train/optimize/deploy our custom model to the device
The PSOC™ 6 MCU is uniquely positioned because it offers:
A Dual-Core Architecture
150 MHz Arm Cortex-M4 (Application + DSP/AI tasks)
100 MHz Cortex-M0+ (Low power management)
This enables:
Sensor acquisition + AI inference on M4
Low-power standby + connectivity management on M0+
Ultra-Low Power Operation
Perfect for:
Solar-powered agricultural devices
Wearables in rural healthcare
Remote environmental monitoring stations
Built-in WiFi & Bluetooth
Using CYW43439:
Farm-to-cloud telemetry
Mobile app connectivity
OTA firmware updates
Security
Secure boot
Cryptographic acceleration
IoT-safe deployments
Implementation Challenges
Reasoning for 4–6 Nodes/Acre
1 acre is approximately equal to 4047 m².
If nodes are placed in a rough grid:
4 nodes = corners → spacing ~60–65 m
6 nodes = corners + midpoints → spacing ~40–50 m
This makes sense only if we are measuring:
microclimate averages (temp/humidity/leaf wetness trends)
irrigation zone-level soil moisture (drip zones / patches)
When 4–6 is not enough!
If the farm has:
Uneven soil type (clay + rocky patches)
Slope variations / water pooling
Different crop varieties in same acre
Multiple irrigation lines
Disease hot-spots (common in humid pockets)
Then we may need 8–12 nodes (or more), because crop stress can be highly localized!
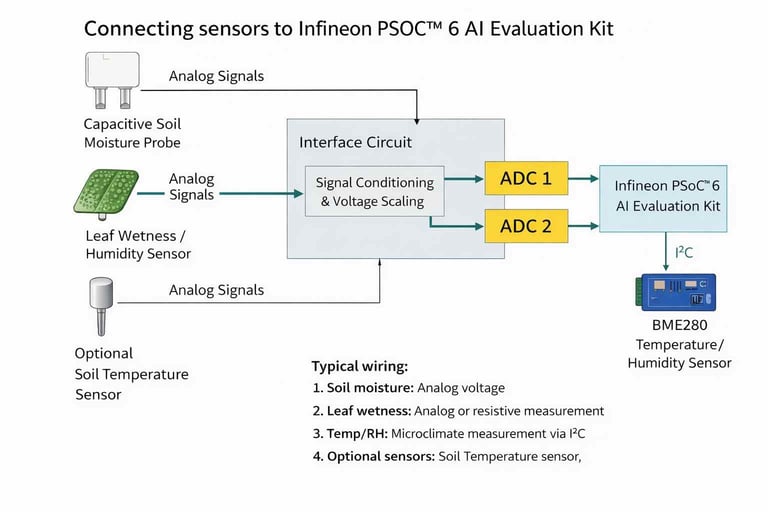
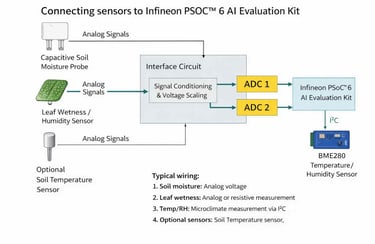
Connecting sensors to Infineon PSOC™ 6 AI Evaluation Kit
Typical wiring:
Soil moisture: Analog voltage via Capacitive Soil Moisture probe to be channelled to PSOC ADC 1
Leaf wetness: Analog or resistive measurement using Leaf Wetness/Humidity sensor via PSOC ADC 2
Temp/RH: Microclimate measurement via BME280 sensor (I²C)
Optional sensors: Soil Temperature sensor (Useful for indicating Root stress and scheduling Irrigation needs)
Inference scheduling on Infineon PSOC™ 6 AI Evaluation Kit
Sensor sampling:
Temp/RH: every 5–10 minutes
Soil moisture: every 15–30 minutes
Leaf wetness: every 15–30 minutes during the day and 5-10 minutes during evening/night (fungal conditions)
Inference runs:
Every 30–60 minutes normally
Every 10–15 minutes during “risk windows” (high humidity + wet leaves + warm temps)
Data storage:
Instead of raw readings, we shall store:
Hourly averages
Min/Max
Risk Score for Disease (0–100)
Water Stress Score (0–100)
A few recent raw points (last 30–60 minutes) for debugging
This keeps transfers fast and leads to a longer Battery life.
Conclusion
Edge AI, when thoughtfully deployed, can help India move from reactive crop protection to predictive crop management thereby improving yield, conserving water, reducing pesticide overuse, and building a more resilient agricultural ecosystem.
Supporting External Links:
https://documentation.infineon.com/psoc6/docs/hsg1651214227031
https://www.infineon.com/evaluation-board/CY8CKIT-062S2-AI
https://www.sciencedirect.com/science/article/pii/S016819232500019X
https://www.arable.com/wp-content/uploads/2022/05/Arable_Leaf_Wetness_2021_12.pdf
Contact
Reach out for collaboration or inquiries
enquiry@thrusteducon.com
© 2025. All rights reserved.